Eidora/Tools/Infographic Generator

AI Infographic Generator

Paste your data.Get a beautiful infographic.

Paste any stats, key facts, or research — and AI turns it into a shareable infographic in under 30 seconds. No Canva, no design skills, no hours of layout work.

6 créditos ao se cadastrar, o suficiente para um primeiro resultado (4 créditos por uso).

Eidora — Infographic
Write your text, or pick an example
Example result: Customer survey

2026 Customer Survey Results

Insights from 1,240 replies

📊

Daily Mobile App Usage

68%
Use the mobile app every day
⏰

Average Session Length

7 minutes
Average session
⭐

Most Requested Feature

41%
Request dark mode
❤️

Likelihood to Recommend

92%
Would recommend to a friend

Generated by Eidora.io

A sample from the “Customer survey” example text. Write your own text and press Generate to make yours.

Eidora's AI Infographic Generator turns your text, notes or numbers into a laid-out infographic in under 30 seconds. 6 credits when you sign up; each infographic uses 4 credits. Download it as a PNG sized for social posts, slides and web pages.

<30s
per infographic
0
made-up numbers
3–5
sections
PNG
download
6
credits when you sign up
What Is This

AI that turns raw data into shareable visuals

Data is only useful if people can understand it. Most infographic tools give you a blank canvas and expect you to be a designer. Eidora flips that — paste your stats, key points, or research summary, and AI builds the visual structure for you in under 30 seconds.

It works for any content: marketing stats, survey results, product comparisons, research findings, annual reports. If you have data worth sharing, Eidora makes it worth looking at.
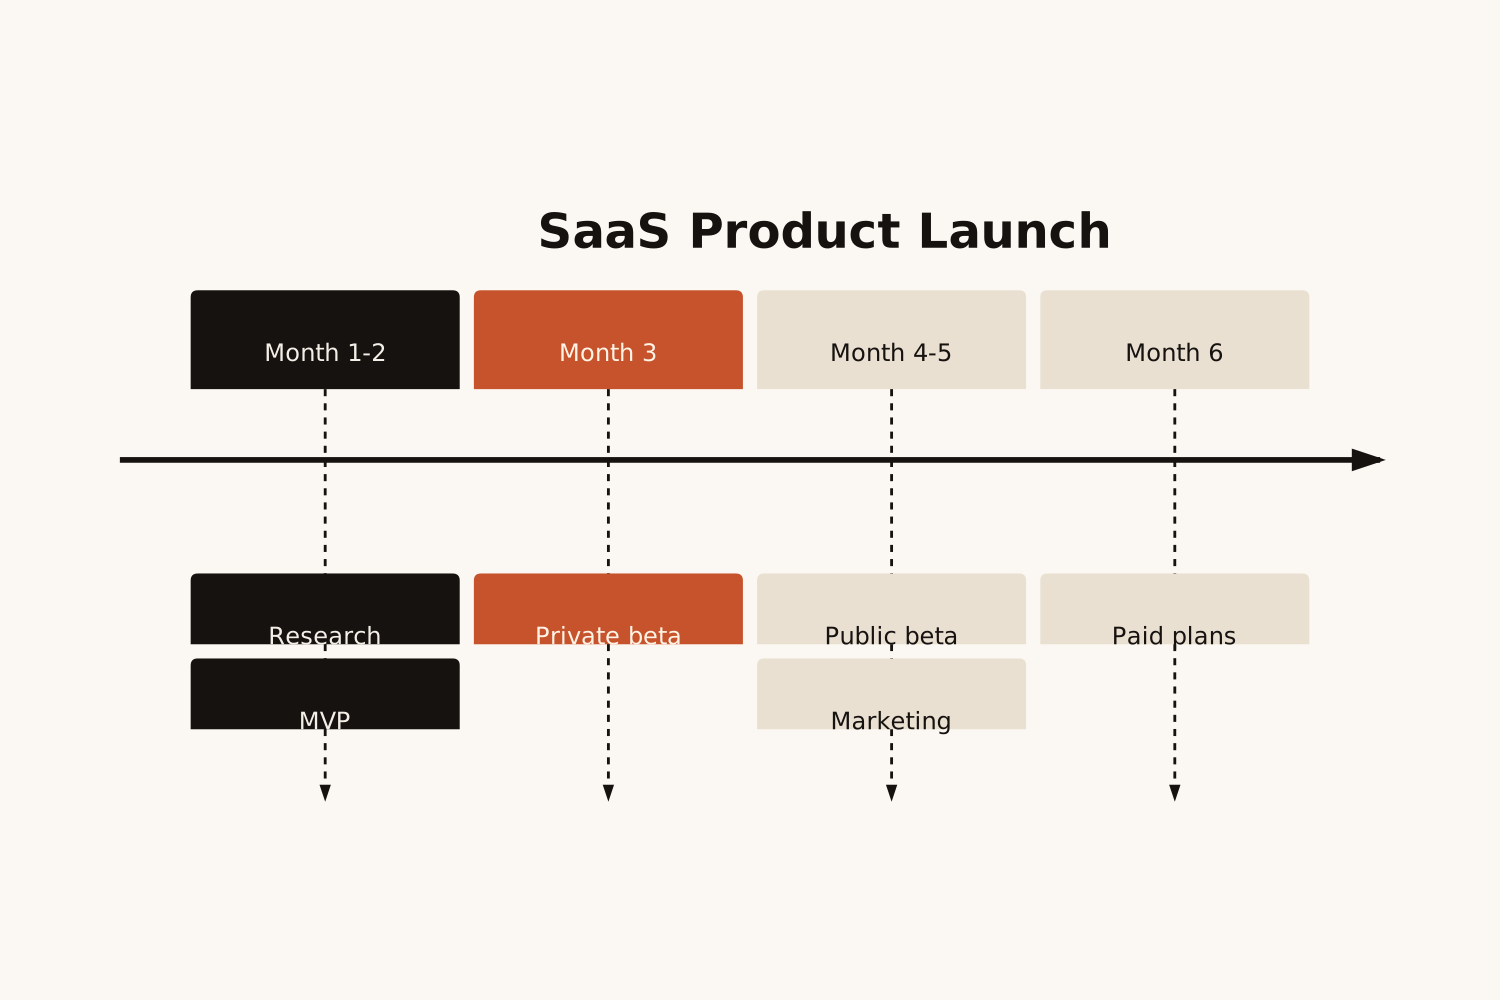
A timeline made with Eidora: a six-month SaaS product launch
Real Use Cases

Who uses this — and how

Infographic Generator
Survey data →
Visual report
Paste survey stats & findings…
Shareable visual report
Marketers & Content Teams
Paste survey results or campaign stats and get a polished visual for social media, blog posts, or client reports — no designer needed.
Infographic Generator
Research findings →
Visual summary
Paste key research points…
Visual research summary
Researchers & Educators
Turn dense research papers or study summaries into clear visual aids for presentations, posters, or class materials that students actually engage with.
Infographic Generator
Product metrics →
Investor visual
Paste KPIs and growth data…
Polished investor-ready visual
Founders & Product Managers
Paste your MRR growth, user numbers, or product milestones and get a visual that tells your story clearly — perfect for pitch decks, updates, and press kits.
How It Works

Paste. Generate. Share.

01
Paste your data or content
Stats, key facts, research points, product metrics — any content works. The more specific your data, the richer the visual output.
02
AI designs the infographic
AI extracts the key data points, creates visual hierarchy, and builds a structured, clean infographic in under 30 seconds.
03
Export and publish anywhere
Download the infographic as a PNG for social posts, slides and blog articles. One click, ready to use.
Why Eidora

Built for people with data worth sharing

No design skills needed
Canva and Adobe require hours of layout work. Eidora generates the entire visual from your text — you never touch a design tool.
Your numbers, not made-up ones
The infographic uses only the numbers and sources you paste, written exactly as you wrote them. It never invents a statistic to fill a gap.
Share-ready in one click
Download a PNG sized for social posts, slides and blog articles.

Common
questions

About the infographic generator.

Stats, survey results, key facts, research summaries, product metrics, comparison data — anything data-driven. The more specific your numbers and facts, the richer the visual output.
Canva requires you to pick a template, drag and drop elements, and manually arrange everything — which takes hours. Eidora lays out the whole infographic from your text in under 30 seconds. You skip the design work entirely.
Refine your text and generate again for a different layout. The download is a PNG image, so changes to colors and fonts happen in an image editor.
PNG, sized for social posts, slides and web pages. There is no SVG or PDF export.
Permitted uses depend on your input rights, applicable law, and the selected third-party model or provider terms. Verify those terms before publishing client deliverables or reports.
Every plan gets the same infographic: 3 to 5 sections built from your text. It shows only the numbers you give it, written as you wrote them; it never adds statistics or sources of its own.
Yes, a free account. To make and download it, sign up: a free account gets 6 credits to start, and each infographic uses 4 credits. Download it when it is ready; it is not saved to your history.
Up to 30 seconds. The request stops at 30 seconds; if that happens, no credits are used and you can try again.
No Canva, no designer, no wait
Paste your data.
Get an infographic.

6 credits when you sign up · No design skills needed · Download as PNG