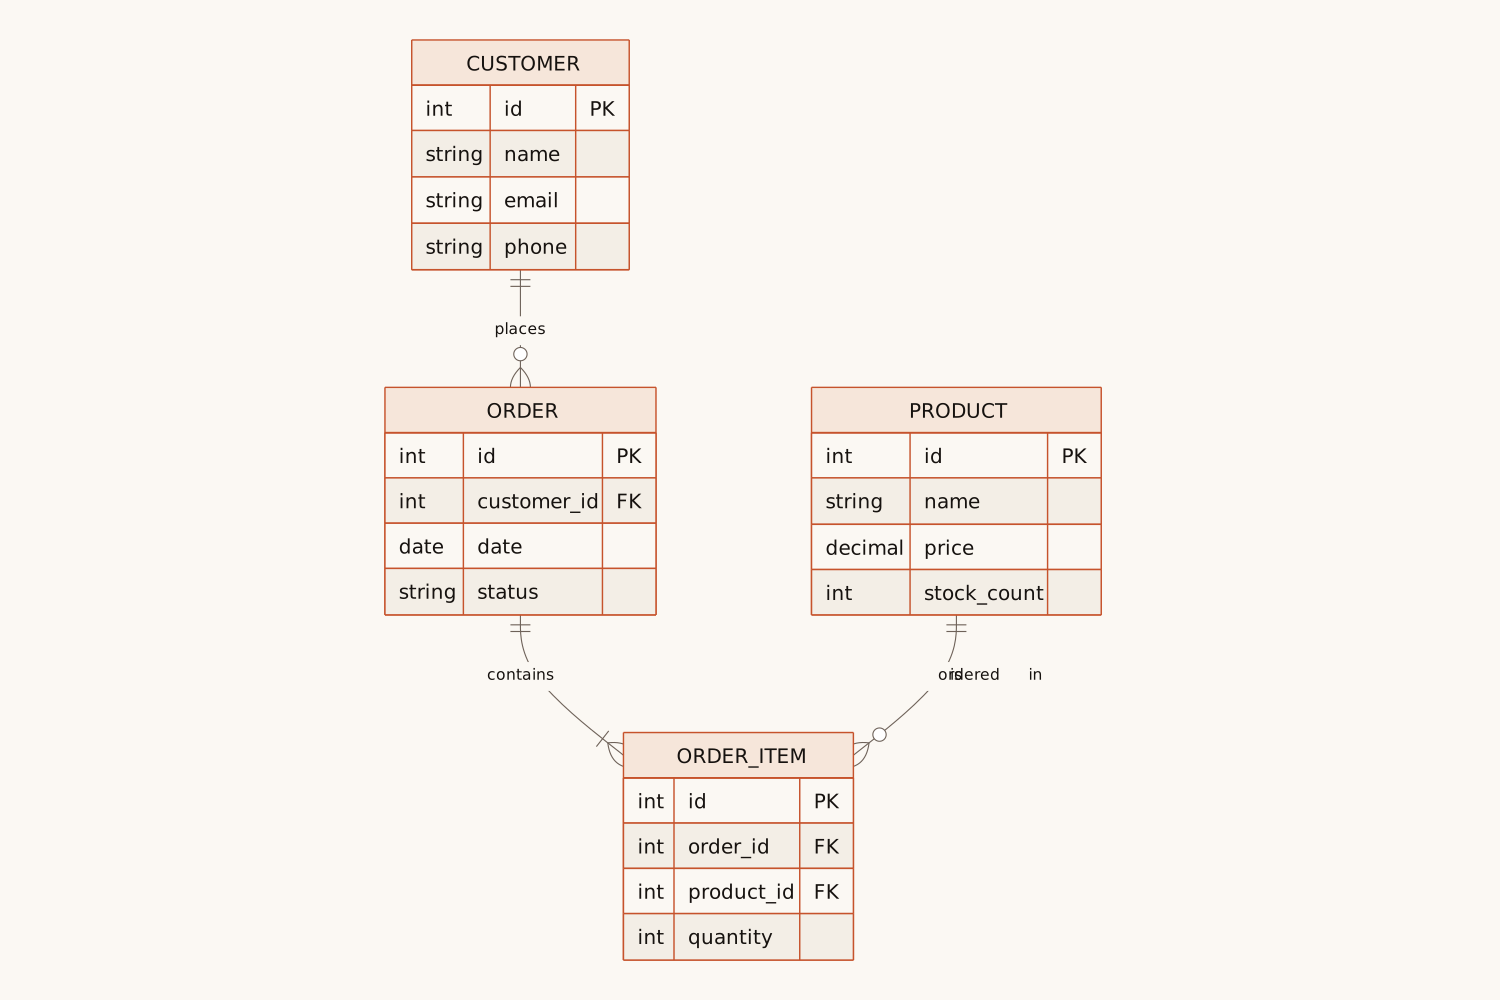
Write what your app stores, or paste CREATE TABLE statements, and AI draws an entity relationship diagram with primary keys, foreign keys and crow’s foot relationships.
<30s
per diagram
0
boxes to drag
~12
tables per diagram
PNG SVG
plus Mermaid code
1
free try; sign up free to download
What Is This
An ER diagram, drawn from your words or your SQL
An entity relationship (ER) diagram shows what a database stores as boxes, one per entity (customers, orders, products) with its fields, and draws how they relate: one customer places many orders, each order has one or more items. Developers sketch one before writing a schema; database courses ask for one in almost every assignment.
Here you describe the data in plain words, give just a topic such as "library system", or paste your SQL. AI picks the entities, the primary and foreign keys and the cardinality of every relationship, and draws the diagram in crow’s foot notation. From SQL it draws exactly your tables, columns and foreign keys, nothing more.
Turn a feature description into a first schema: the tables, their keys and how they connect, before you write a single migration.
ER Diagram Generator
Existing SQL → A map of your schema
Paste CREATE TABLE statements…
ER diagram of your tables
Engineers & data analysts
Paste the CREATE TABLE statements of a database you inherited and see its tables and foreign keys at a glance, for onboarding or documentation.
ER Diagram Generator
Course case study → ER diagram for class
Paste the case description…
Crow’s foot ER diagram
Students & teachers
Paste a database course case ("students enroll in courses, each enrollment has a grade") and get a crow’s foot diagram to check your own design against.
How It Works
Describe. Generate. Build.
01
Describe your data
Write what the system stores and how things relate, give just a topic, or paste CREATE TABLE statements.
02
AI draws the ER diagram
AI picks the entities, fields, primary and foreign keys and the cardinality of each relationship, in under 30 seconds.
03
Export or keep editing
Download PNG or SVG, copy the Mermaid code into GitHub, Notion or your docs, or open the diagram in draw.io to change it by hand.
Why Eidora
Built for database design
Text or SQL
Describe the data in plain words or paste your SQL. From SQL it draws exactly your tables and foreign keys; from text it adds only the ids and foreign keys the relationships need.
Real crow’s foot notation
Primary, foreign and unique keys are marked, and every relationship shows its cardinality: exactly one, zero or one, one or more, zero or more.
Fits where you already work
PNG for slides, SVG for docs, Mermaid code for GitHub and Notion, and draw.io when you want to move the boxes by hand.
An entity relationship diagram shows the entities a database stores (customers, orders, products), the fields of each, and how they relate, such as one customer placing many orders. It is the usual first step in designing a database.
Yes. Describe your data in plain words, give a topic, or paste SQL, and Eidora’s AI draws the diagram: one box per entity with its fields and keys, and a line with the right cardinality for each relationship.
Yes. Paste your CREATE TABLE statements and the diagram shows exactly those tables, columns, types and keys, with one relationship per foreign key. Mermaid cannot show a comma inside a type, so DECIMAL(10,2) is shown as decimal.
Crow’s foot notation, the one most database tools use: the line ends show exactly one, zero or one, one or more, or zero or more. It does not draw Chen notation (diamonds for relationships, ovals for attributes).
What your system stores and how the things relate, for example "customers place orders; each order has at least one item". Words like "each", "at least one" and "at most one" set the cardinality. You can also write only a topic, such as "hotel booking system", and get the usual design for it.
Yes. Table and column names stay in English, as in a real database, and the diagram adds display names, field notes and relationship labels in your language.
Yes. Press "Edit in draw.io" to open the diagram in draw.io, where you can move and restyle it. You can also refine your text and generate again, or copy the Mermaid code into Mermaid Live, GitHub, Notion or any Markdown editor that supports it.
PNG for presentations and documents, SVG for scalable graphics, and Mermaid code for GitHub, Notion, and any Markdown editor that supports it.
About 12 tables per diagram, on every plan. For a bigger schema, split it by area (users and accounts, orders and payments) and make one diagram for each.
Permitted uses depend on your input rights, applicable law, and the selected third-party model or provider terms. Verify those terms before publishing client deliverables or documentation.
Not to try it. You can make one diagram a day without an account and see the result. To download the ER diagram, copy the Mermaid code or open it in draw.io, sign up free: a free account gets 16 credits to start and 4 free credits every day, and each diagram uses 4 credits. Without an account, Eidora’s diagram tools share that one diagram a day. Download the diagram when it is ready; it is not saved to your history.