examplesDiagrams
10 Venn Diagram Examples You Can Copy and Edit
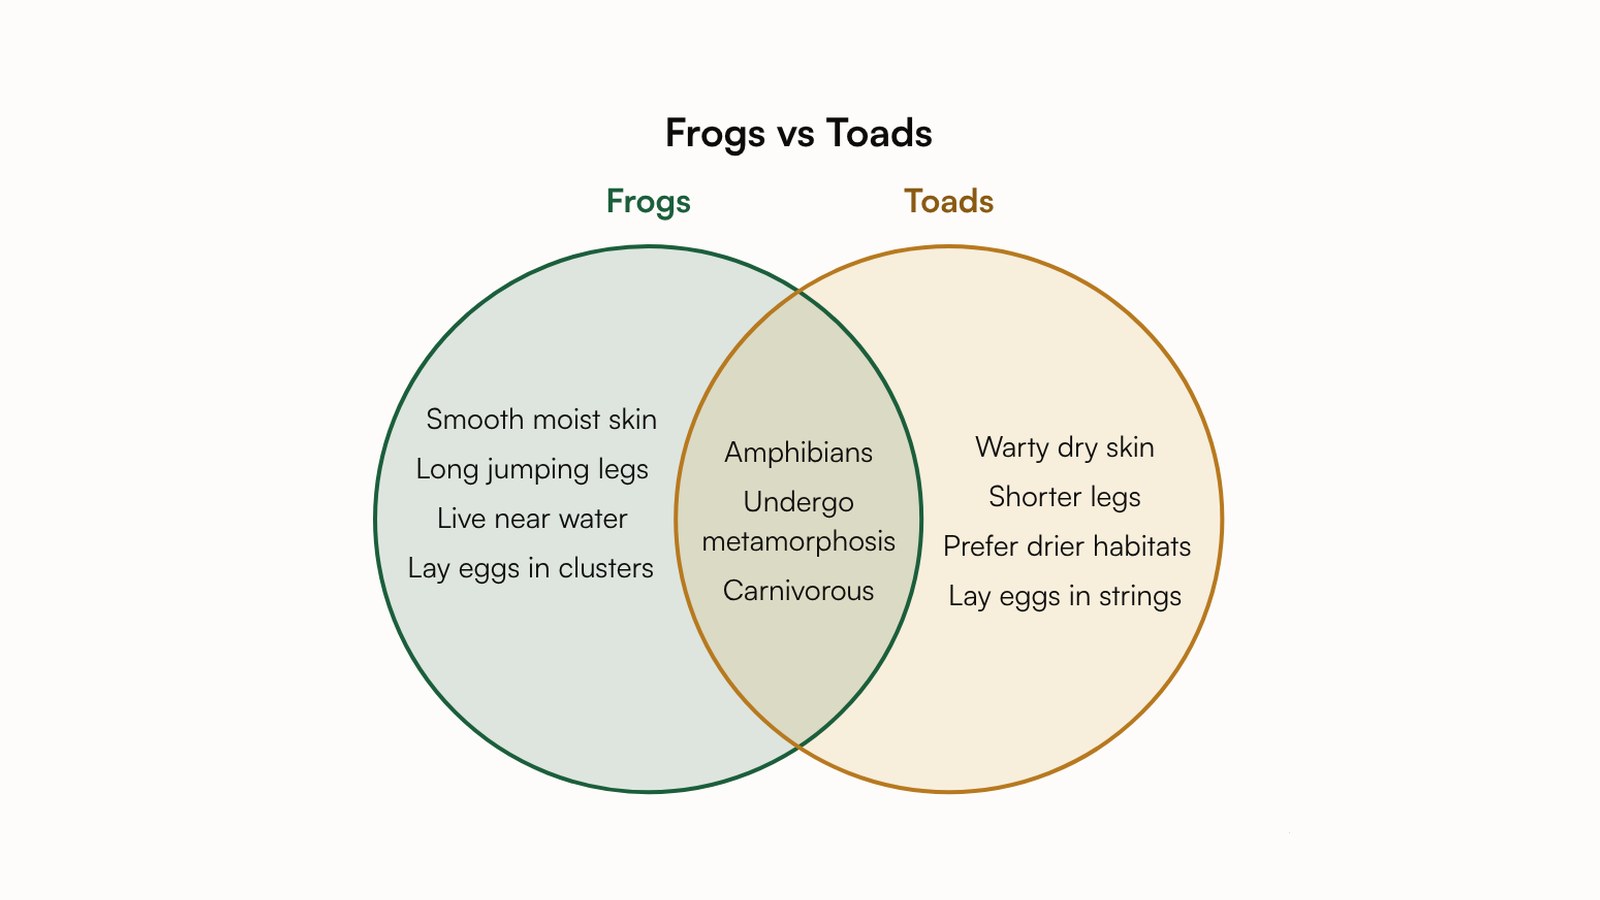
A Venn diagram shows how groups overlap. Each group is a circle; what two groups share sits where their circles overlap, and what only one group has stays in the rest of its circle. That makes it the go-to picture for comparing and contrasting in class, for sorting things into sets in math, and for any decision where you weigh two or three options.
Below are 10 Venn diagram examples with two and three circles, for science, math, history, everyday life and data. Each one was made with Eidora's Venn diagram maker from the short text shown under it: some from a comparison of a few words, others from lists of names or fruit. Press Use this text under any example to open the maker with that text, change it, and get your own diagram in under 30 seconds.
Make your own Venn diagram
Name two or three things to compare, or paste one list per group. The Venn diagram maker opens with your text in its box; press Generate there to draw it.
Free to try: one diagram a day without an account.
How to Read a Venn Diagram
Each circle is one group, named above or below it.
The part of a circle that overlaps no other circle holds what only that group has: in a frogs vs toads diagram, "warty dry skin" is only in the toads circle.
Where two circles overlap is what both groups share: frogs and toads are both amphibians.
With three circles, the middle is what all three share, and each of the three pair regions is what exactly two of them share.
An empty region is an answer too. It means nothing belongs to exactly those groups, as in the math example below, where no number from 1 to 20 is even, prime and a multiple of 3.
1. Frogs vs Toads Venn Diagram
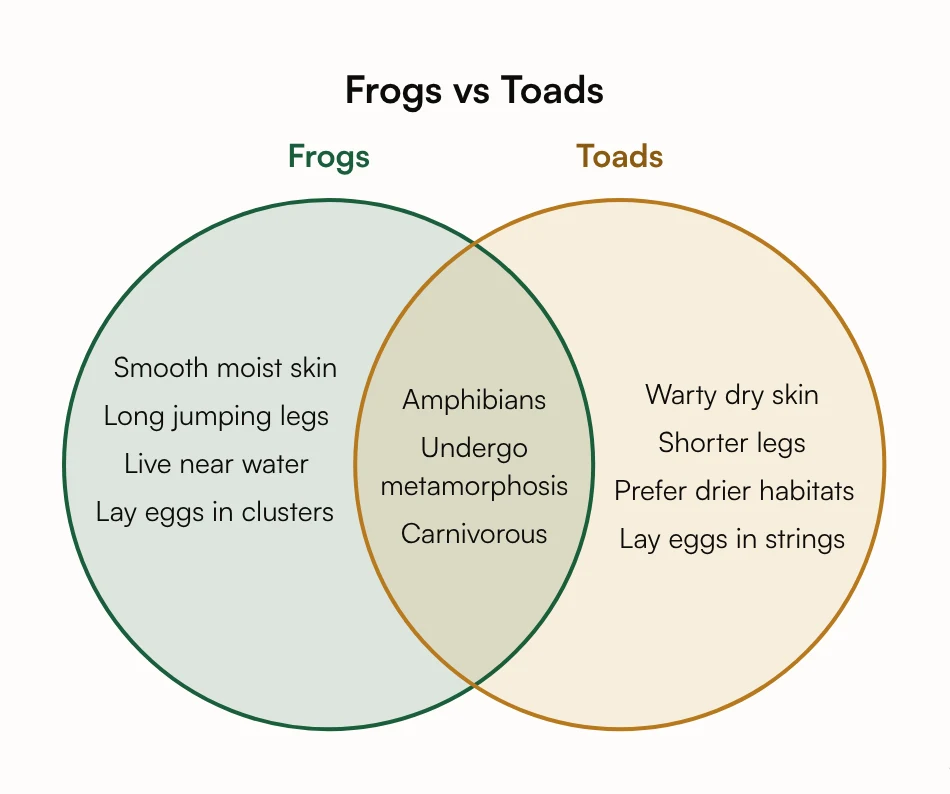
The classic compare-and-contrast Venn diagram for a science class. Each side answers the same questions, so you can read straight across: smooth moist skin against warty dry skin, long jumping legs against shorter legs, eggs laid in clusters against eggs laid in strings. The overlap holds what frogs and toads share: both are amphibians, both go through metamorphosis, and both eat other animals.
This diagram was made from five words. Given only a comparison, the maker draws what a teacher would draw, using well-established facts.
2. Mitosis vs Meiosis Venn Diagram
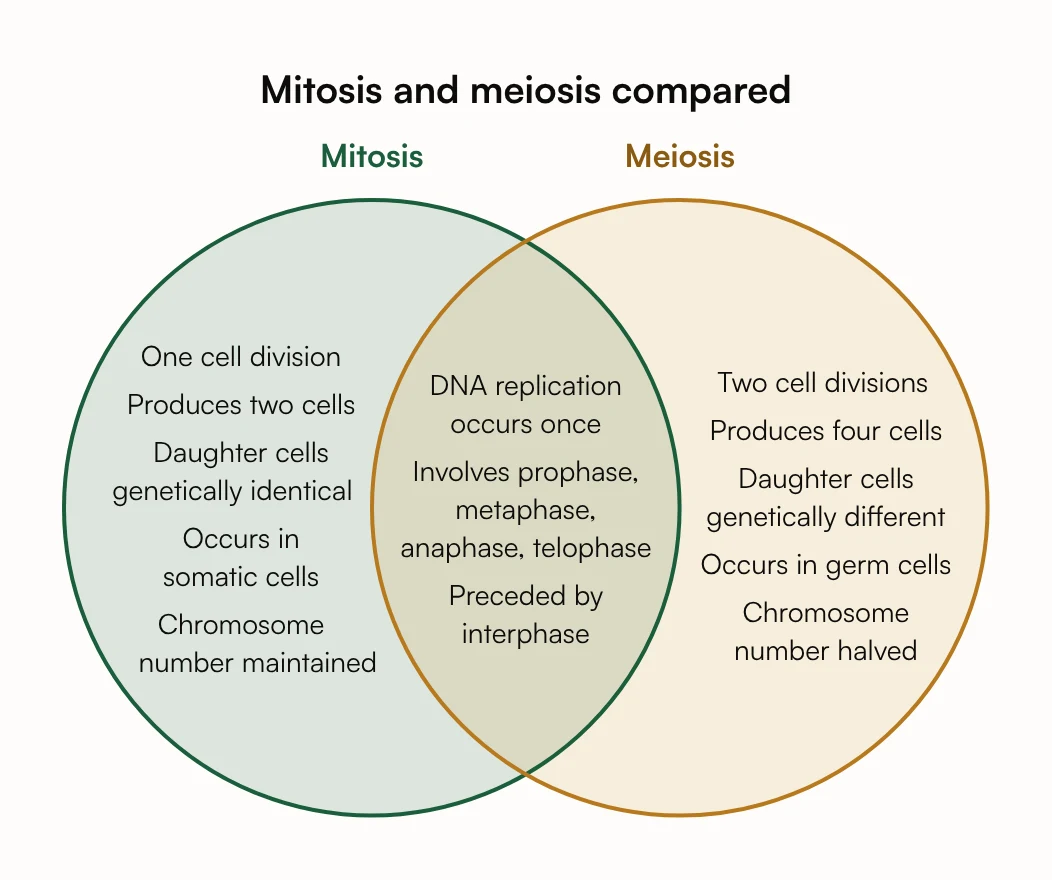
A biology favourite, because the two kinds of cell division are easy to mix up. Mitosis is one division that makes two genetically identical cells and keeps the chromosome number; meiosis is two divisions that make four genetically different cells with half the chromosomes. Both copy the DNA once first, both start after interphase, and both go through prophase, metaphase, anaphase and telophase.
Notice how each item on one side has a partner on the other. That is what makes a comparison Venn diagram easy to study from.
3. Viruses vs Bacteria Venn Diagram
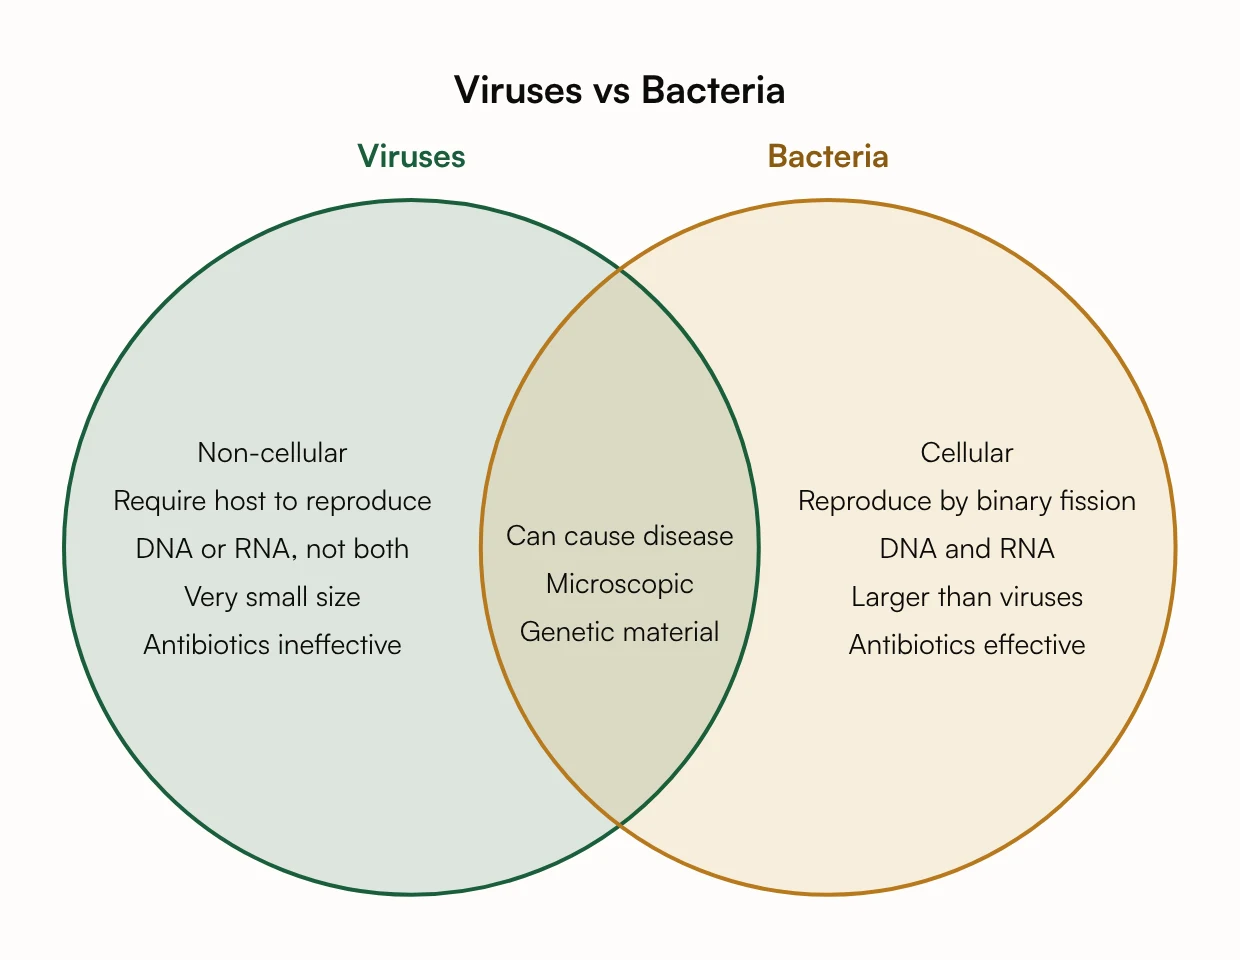
A health and biology comparison that clears up a common confusion. Bacteria are living cells that reproduce on their own by binary fission and can be treated with antibiotics; viruses are not cells, need a host cell to reproduce, carry either DNA or RNA (not both) and are not affected by antibiotics. What they share: both are microscopic, both carry genetic material, and both can cause disease.
4. Plants, Animals and Fungi: a Three-Circle Venn Diagram
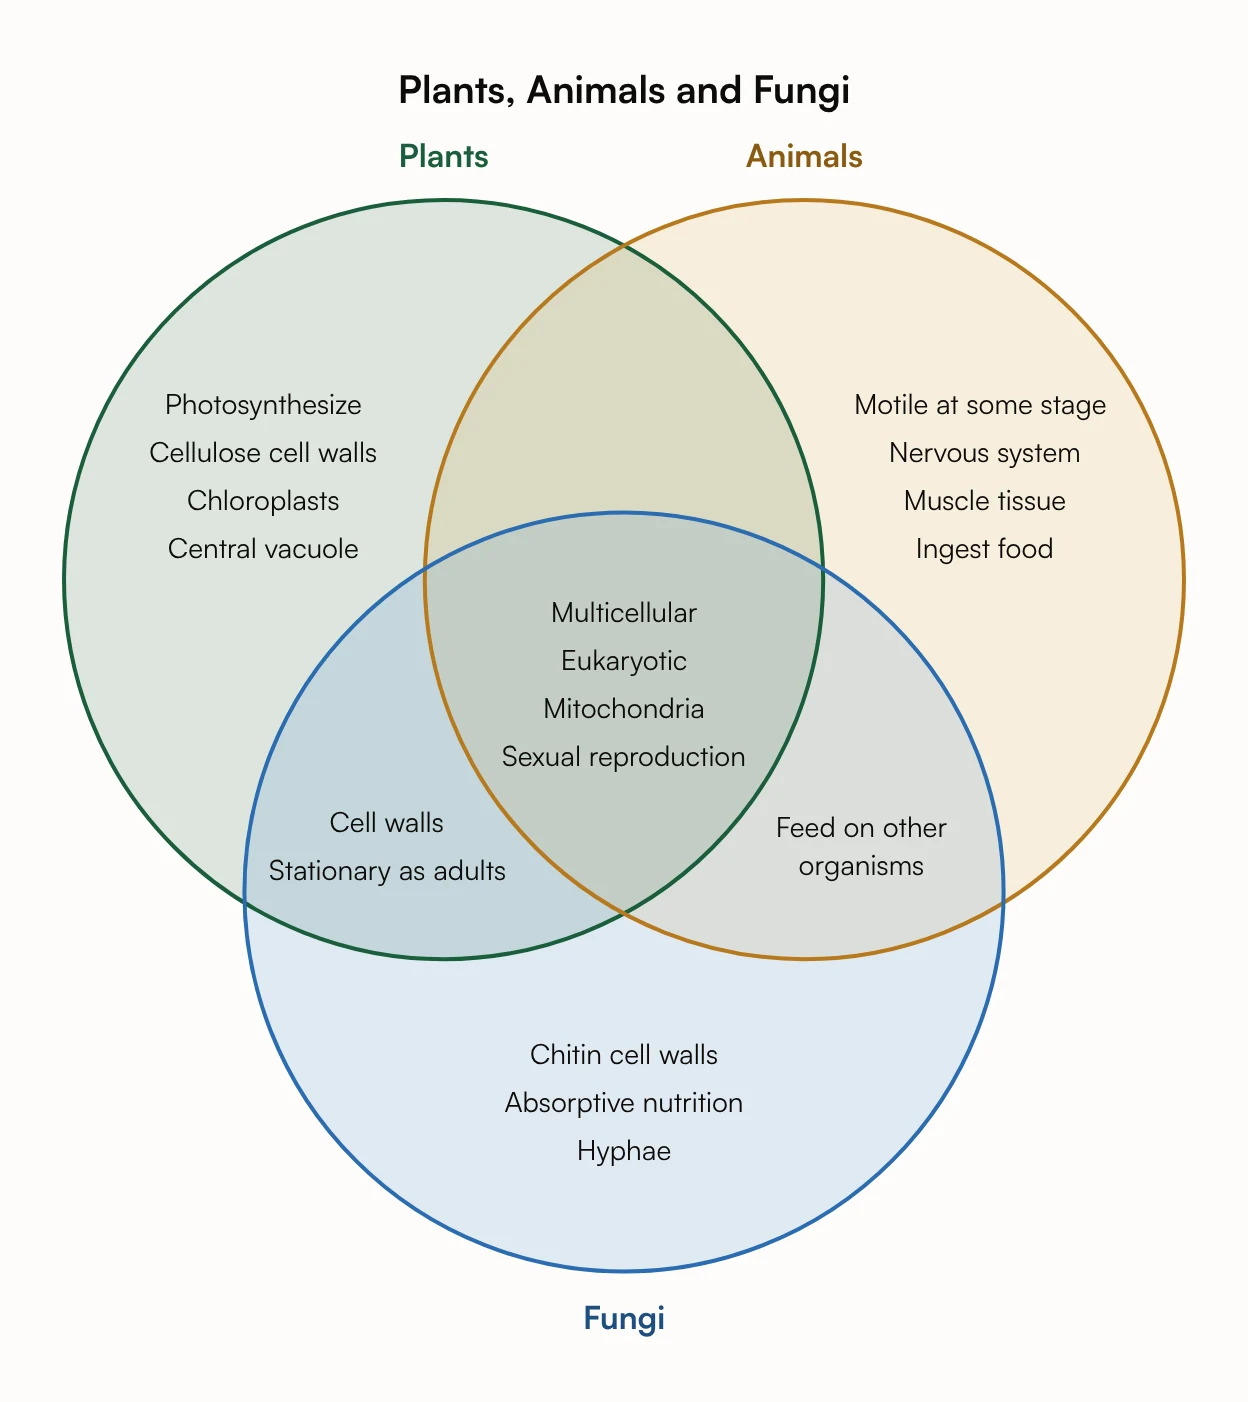
With three circles there are seven regions: each circle alone, each pair, and the middle. Here the pairs do the teaching. Plants and fungi both have cell walls (of cellulose and of chitin) and both stay in one place; animals and fungi both feed on other organisms. In the middle is what all three kingdoms share: eukaryotic cells with mitochondria, and sexual reproduction.
The pair of plants and animals is empty, and that is fine: an empty region is part of the answer. A few things are simplified for school level, for example most fungi are multicellular, but yeasts are single cells.
5. Mercury, Venus and Earth Venn Diagram
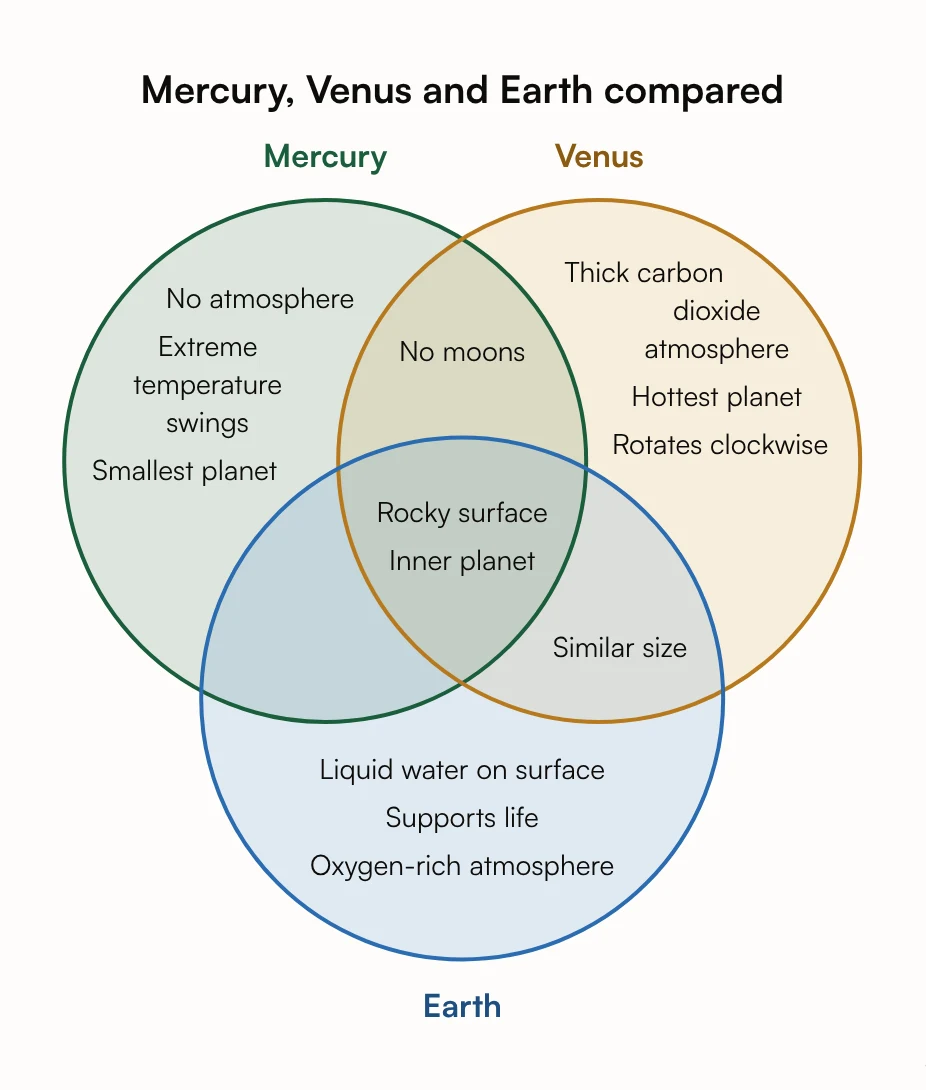
A space science example with three circles. Mercury is the smallest planet, with almost no atmosphere and extreme temperature swings; Venus has a thick carbon dioxide atmosphere, is the hottest planet and spins the opposite way; Earth has liquid water on its surface and supports life. Mercury and Venus share having no moons, Venus and Earth are a similar size, and all three are rocky inner planets.
6. Math Venn Diagram: Even, Prime and Multiples of 3
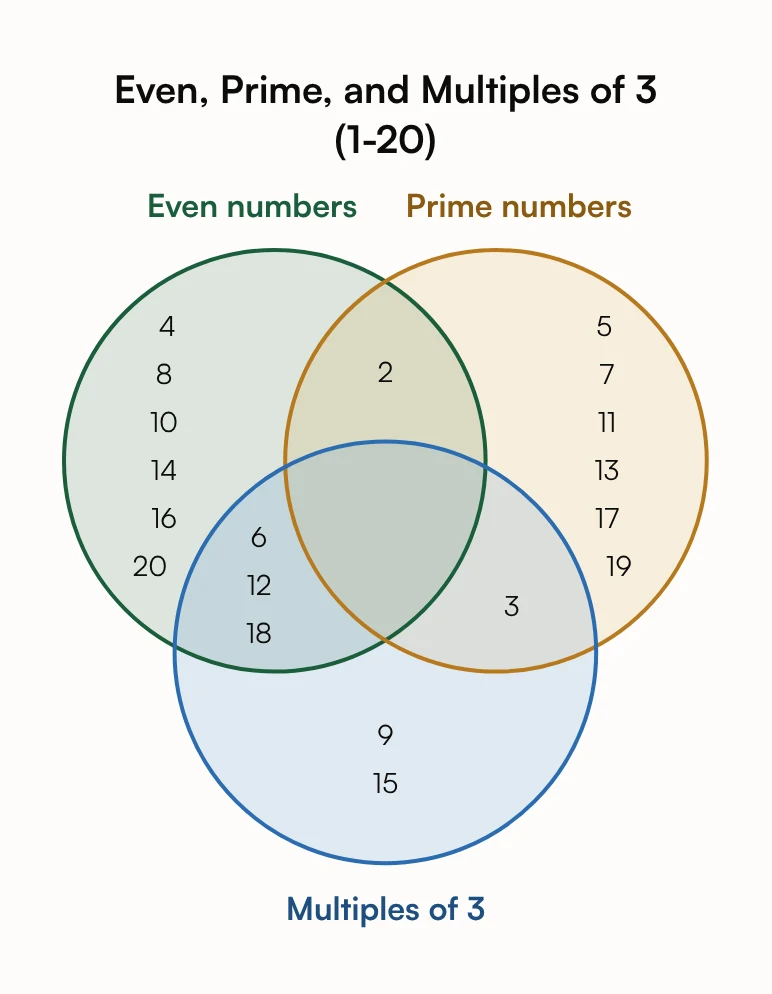
Venn diagrams are a standard way to teach sets in math. Here the numbers 1 to 20 are sorted three ways. 2 is the only even prime, so it sits where those two circles meet; 3 is both prime and a multiple of 3; 6, 12 and 18 are even multiples of 3. The middle is empty, because no number is even, prime and a multiple of 3 at once. 1 belongs to none of the three sets, so it is not shown.
We checked every number in this one by hand. When the sets come from a rule rather than a list, check the result the same way, or write out the numbers of each set yourself, as in examples 9 and 10, so that the maker only has to sort them.
Text used for this chart
Venn diagram of the numbers 1 to 20: even numbers, prime numbers and multiples of 3
Use this text →7. World War I vs World War II Venn Diagram
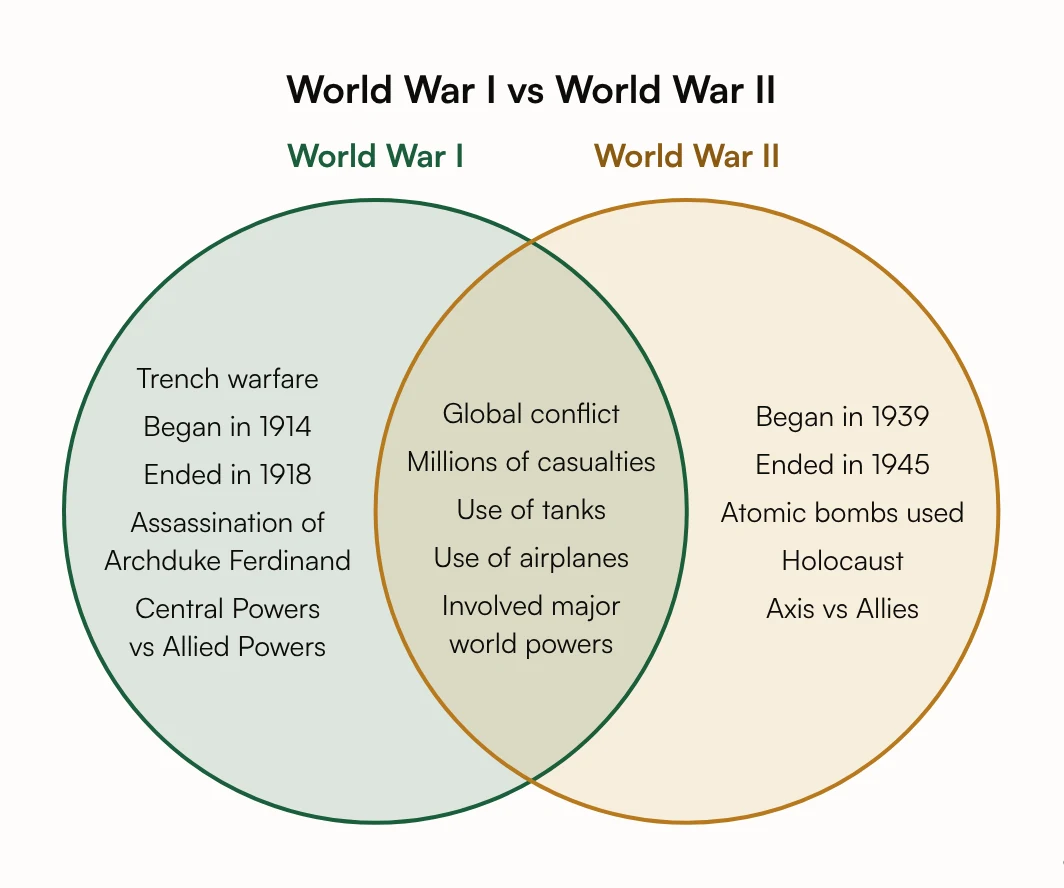
A history comparison. World War I ran from 1914 to 1918, began after the assassination of Archduke Franz Ferdinand and is remembered for trench warfare; World War II ran from 1939 to 1945, saw the Holocaust and the first use of atomic bombs. Both were global wars between the major powers that cost millions of lives, and both used tanks and airplanes.
For an essay, a Venn diagram like this one is the planning step: the overlap gives you the similarities paragraph, each side a differences paragraph.
8. Renting vs Buying a Home Venn Diagram
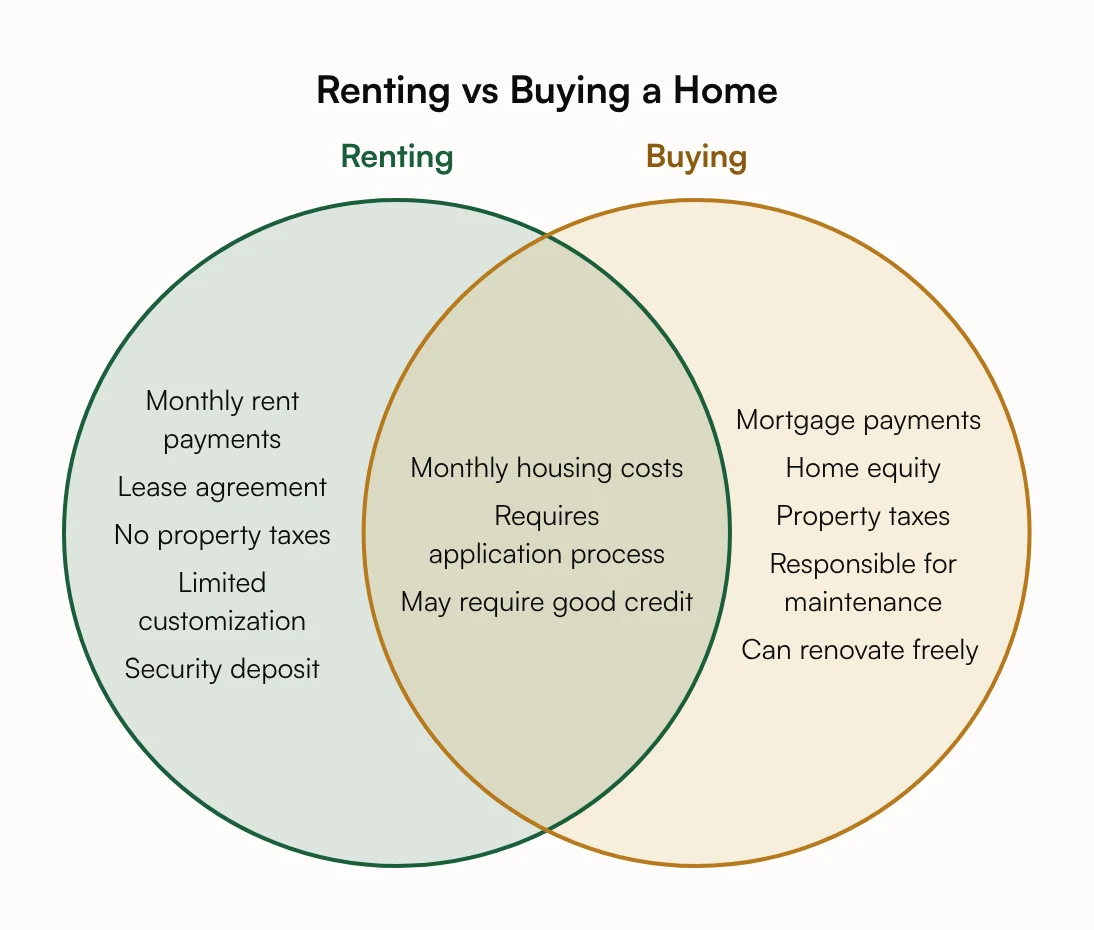
Venn diagrams are not just for school. This one lays out a big life decision: renting means monthly rent, a lease and a security deposit, with less freedom to change the place; buying means mortgage payments, property taxes and maintenance, but also equity and the freedom to renovate. Both come with monthly housing costs and an application, and both may need good credit.
Use the diagram to see the trade-offs side by side, then add your own numbers before you decide.
9. Two Lists: Who Is in Both Clubs?
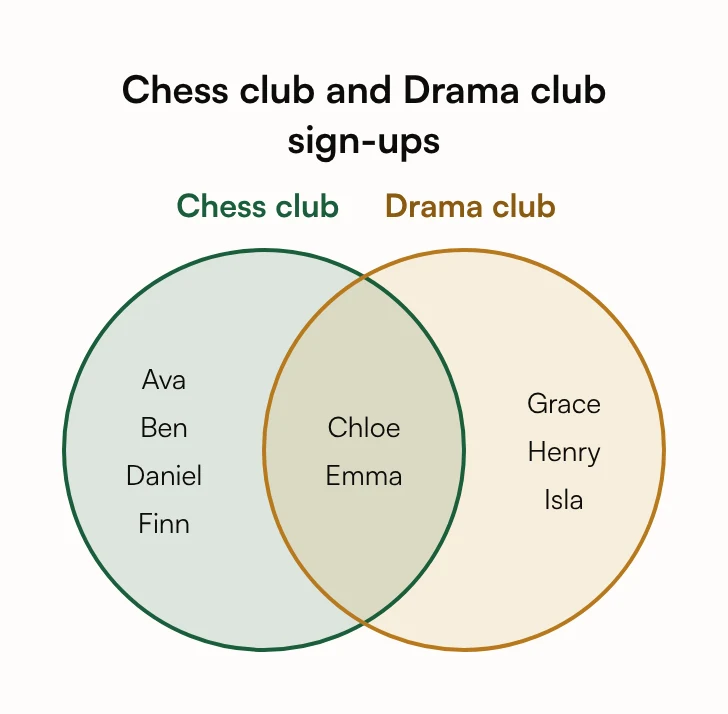
Paste two lists and the maker sorts every name into place: Chloe and Emma signed up for both clubs, so they sit in the overlap; everyone else stays in their own circle. Nothing is added and no name is dropped.
The same works for anything you can list: which customers bought which products, which tools each team uses, which students passed which tests. With two circles each region holds up to 10 items; a longer list ends with a line that says how many more there are.
Text used for this chart
Who signed up for which club? Chess club: Ava, Ben, Chloe, Daniel, Emma, Finn Drama club: Chloe, Emma, Grace, Henry, Isla
Use this text →10. Three Lists: Red, Sweet and Round Fruits
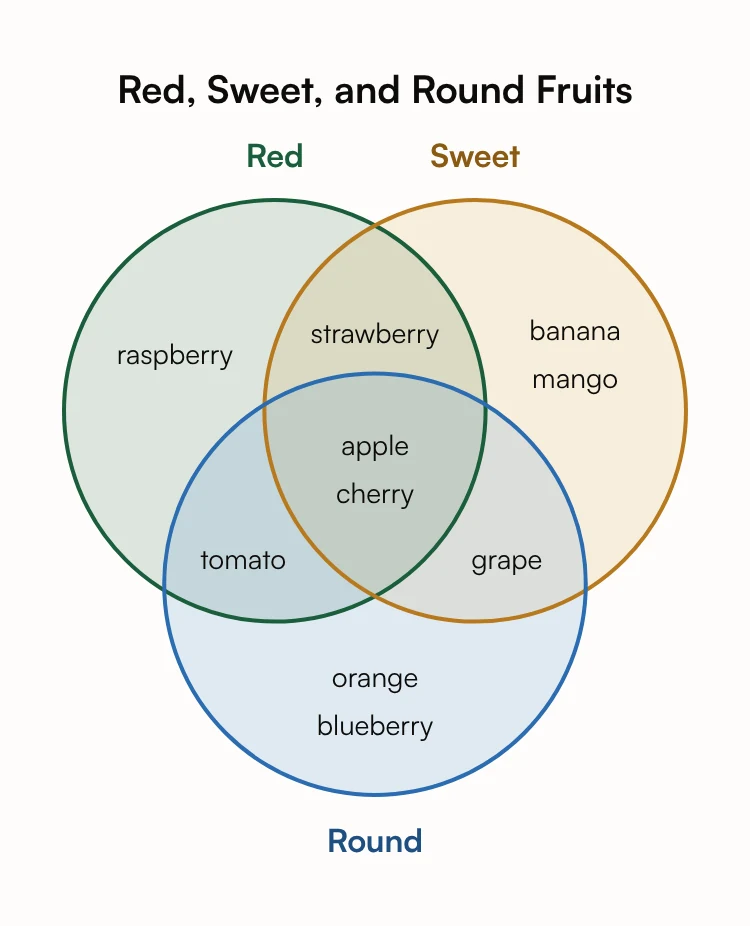
Three lists sorted into all seven regions. Apple and cherry are on every list, so they go in the middle; strawberry is red and sweet, tomato red and round, grape sweet and round; the rest are in one circle each. A diagram like this is a quick way to check a classification exercise, because every item can only be in one place.
Text used for this chart
Which fruits are red, which are sweet, which are round? Red: apple, cherry, strawberry, tomato, raspberry Sweet: apple, cherry, strawberry, banana, mango, grape Round: apple, cherry, tomato, orange, grape, blueberry
Use this text →Two Circles or Three?
Two circles are best for compare and contrast: two things, their differences on each side and their similarities in the middle. Most school Venn diagrams have two circles, and they are the easiest to read.
Three circles show seven regions, so they suit sorting tasks (numbers into sets, fruits into lists) and comparisons where the pairs matter, such as plants, animals and fungi. Keep the items short, because the pair regions are small.
Four or more groups are hard to draw as circles and harder to read. Use a table, or make a few Venn diagrams of two or three groups each.
How to Make Your Own Venn Diagram From an Example
Step 1: Pick the closest example. Start from the one whose subject or kind of text looks most like yours: a comparison, a sorting task or lists.
Step 2: Press Use this text. The Venn diagram maker opens with the example's text in its box.
Step 3: Change the text. Name the two or three things you want to compare, or paste your lists, one list per group. From your lists, every member goes in the region of exactly the groups it is listed in; from a comparison alone, the maker draws what a teacher would draw.
Step 4: Press Generate. The diagram is ready in under 30 seconds, with the circles sized to fit the words. You can make one diagram a day without an account; a free account gets 16 credits to start and 4 free credits a day, and each diagram uses 4.
Step 5: Download or edit it. Download the diagram as a PNG or SVG for slides and worksheets, or copy its Mermaid code to change any word yourself. Downloading needs a free account.
Tips for a Good Venn Diagram
Compare like with like. If one side says "smooth moist skin", the other side should say what toads' skin is like. Matching items make the differences easy to read across.
Make the overlap specific. "Both are animals" says little; "both go through metamorphosis" says something. The overlap is where most of the understanding shows.
Check every item against every circle. If something is true of both groups, it belongs in the overlap, not in one circle. Things a group lacks are the easiest to misplace: "no chlorophyll" is true of animals and fungi alike.
Keep items short. A word or a short phrase per item, never a sentence.
Leave an empty region empty. Do not invent a similarity to fill the middle.
Quick Answers About Venn Diagram Examples
What is an example of a Venn diagram? Two overlapping circles comparing frogs and toads: the differences in each circle, and what both share (amphibians, metamorphosis) in the overlap. The 10 examples above cover science, math, history, everyday life and data.
What is a 3-circle Venn diagram? A Venn diagram of three overlapping circles with seven regions: one for each group alone, one for each pair, and one in the middle for all three. Examples 4, 5, 6 and 10 above have three circles.
What goes in the middle of a Venn diagram? What all the groups share. With two circles that is the overlap; with three, the small region where all three circles meet.
Can I make a Venn diagram from my own lists? Yes. Paste one list per group into the Venn diagram maker: every member goes in the region of exactly the groups it is listed in, and nothing is added.
How many items fit in a Venn diagram? In Eidora's maker, up to 10 in each region of a two-circle diagram, and with three circles up to 7 in a circle alone and 4 in each overlap. When a list is longer, the last line of the region says how many more there are.
How do I make a Venn diagram for free? Type a comparison or paste your lists into the Venn diagram maker. You can make one diagram a day without an account and see the result.
Start From the Closest Example
Every Venn diagram starts with a question: what do these share, and what sets them apart? Find the example above that looks most like yours, press Use this text and change it, or start from a blank box in the Venn diagram maker.