An org chart (organizational chart) shows who works in an organization and who reports to whom: one box per person or position, joined by lines from each manager to their team. The quickest way to make your own is to start from an example that looks like your organization and change the names.
Below are 12 org chart examples, from a nine-person bakery to a hospital, covering the main types: hierarchical, functional, divisional and flat. Every chart was made with Eidora's org chart generator from the short text shown under it, so you can see exactly what went in. Press Use this text under any example to open the generator with that text, change the names and roles, and get your own chart in under 30 seconds.
Make your own org chart
Write who reports to whom, or paste a list of names and titles. The org chart generator opens with your text in its box; press Generate there to draw it.
Free to try: one diagram a day without an account.
How to Read These Org Chart Examples
Each box is one person or one position. When the name is known, it is in bold above the job title; when only the role is known, the box shows the role. A line from a box down to the boxes below it means those people report to that manager.
Colors show levels. The top of the organization is dark green, people who manage someone are light green, and everyone else is white.
Stacked boxes are people with no reports of their own, listed in a column under their manager so the chart stays narrow enough to read.
A dashed line joins an assistant or adviser to the person they support, beside the team rather than above it.
A number in brackets, as in "Bakers (2)", stands for several people with the same role. It only appears when the text gives the number.
1. Small Business Org Chart
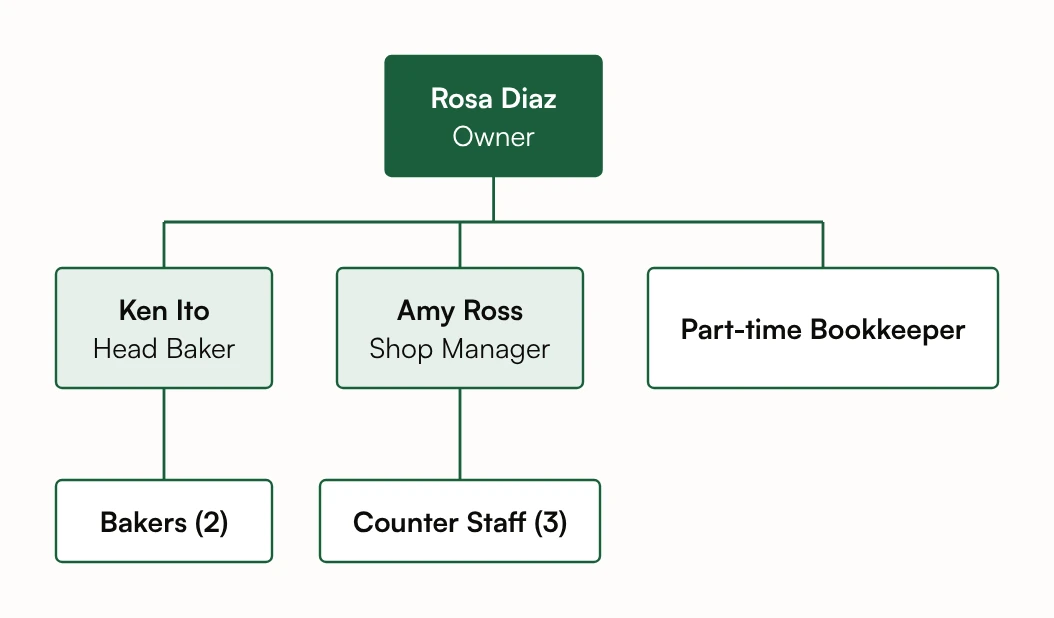
A small business usually has one owner and two or three people who run the day-to-day work, each with a small team. This bakery has a head baker who leads the bakers and a shop manager who leads the counter staff, plus a part-time bookkeeper who reports straight to the owner.
Even a team this small benefits from a chart: it tells new staff who to ask, and it shows the owner when one person is carrying too much.
Text used for this chart
Small bakery: Rosa Diaz is the owner. The head baker, Ken Ito, leads two bakers. The shop manager, Amy Ross, leads three counter staff. A part-time bookkeeper reports to Rosa.
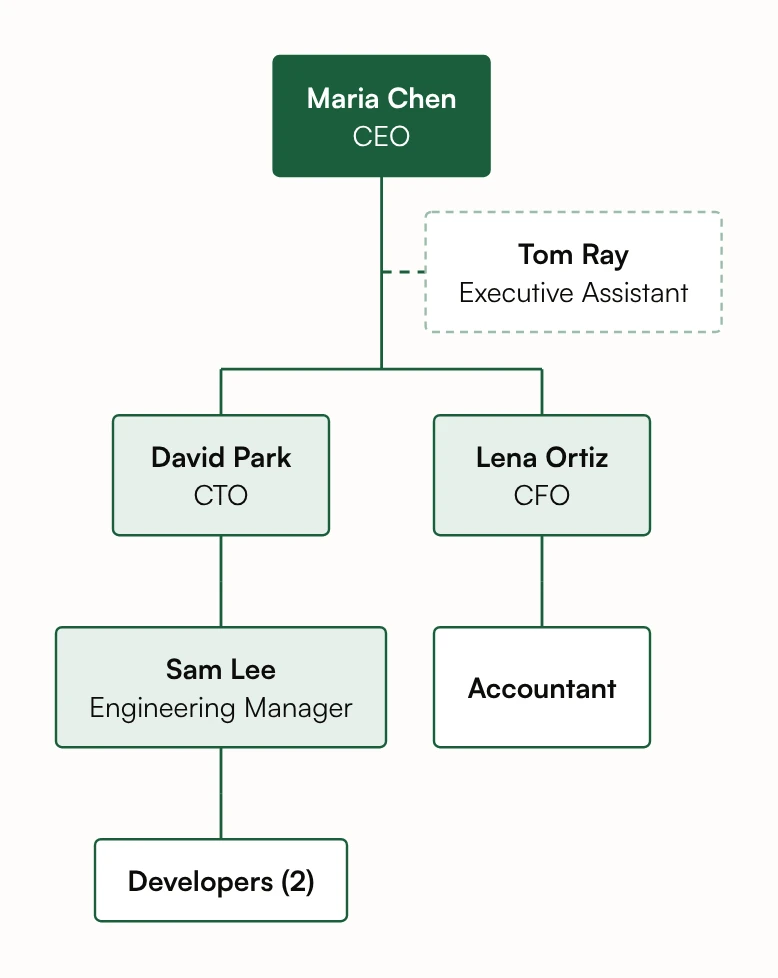
Early-stage startups are shallow: the founders sit at the top, and each one leads an area. Here the CTO and CFO report to the CEO, an engineering manager runs the developers, and the CEO's executive assistant is joined by a dashed line, beside the team rather than above it.
Startup org charts change every few months. Keep the text you made yours from, and when someone joins, add one sentence and generate the chart again instead of redrawing it.
Text used for this chart
Our startup: Maria Chen is the CEO. David Park (CTO) and Lena Ortiz (CFO) report to her, and Tom Ray is her executive assistant. Sam Lee, an engineering manager, reports to David and leads two developers. An accountant reports to Lena.
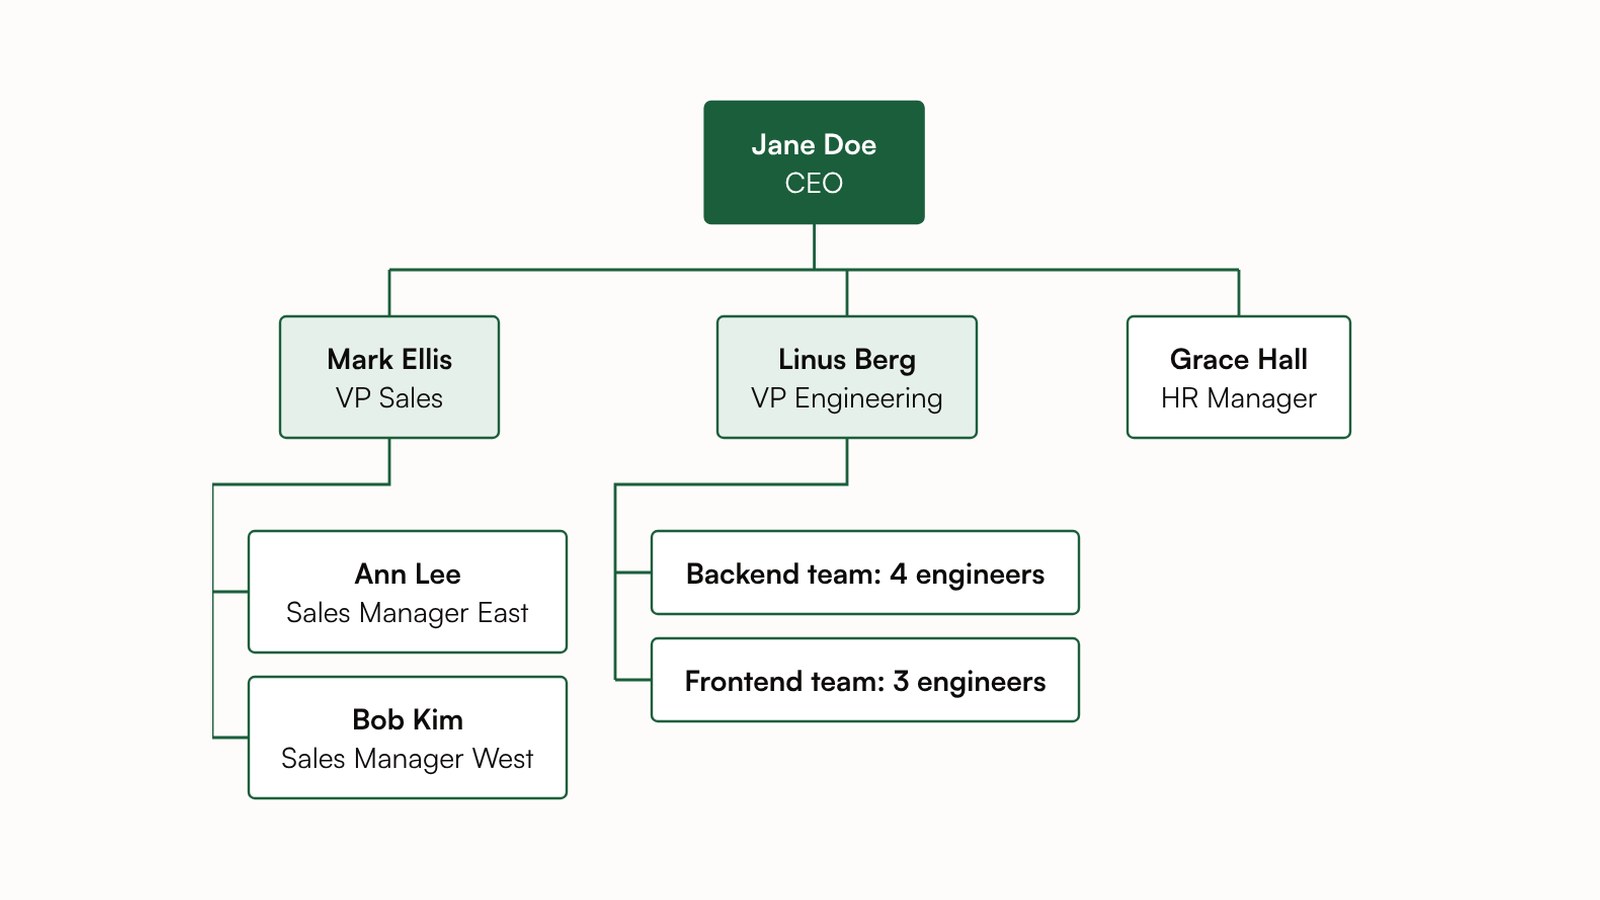
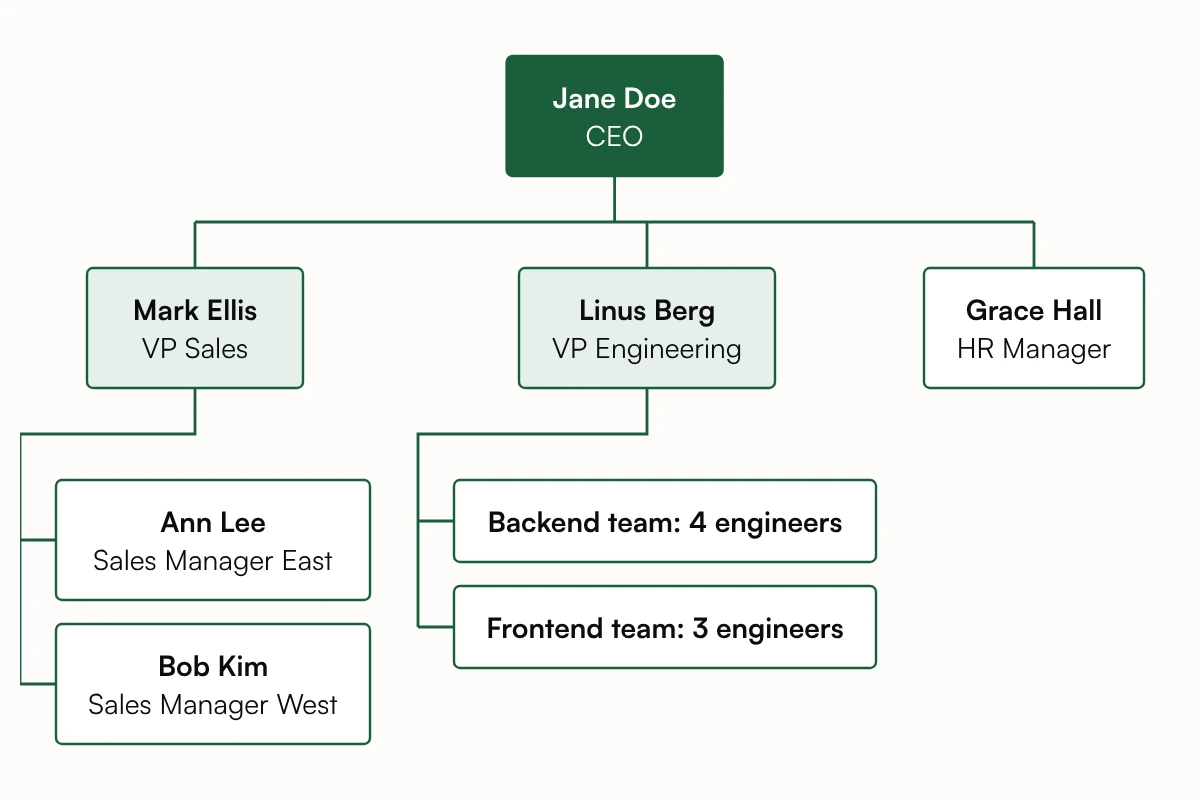
This is the classic hierarchical org chart: a chain of command from the CEO down through vice presidents to managers and teams. It was made from an indented list, with each person's team indented under them, which is easy to copy out of a spreadsheet or an HR system.
If you already have a list of names and titles, paste it as it is. Each line becomes a box, and the indentation becomes the reporting lines.
Text used for this chart
CEO - Jane Doe
VP Sales - Mark Ellis
Sales Manager East - Ann Lee
Sales Manager West - Bob Kim
VP Engineering - Linus Berg
Backend team: 4 engineers
Frontend team: 3 engineers
HR Manager - Grace Hall
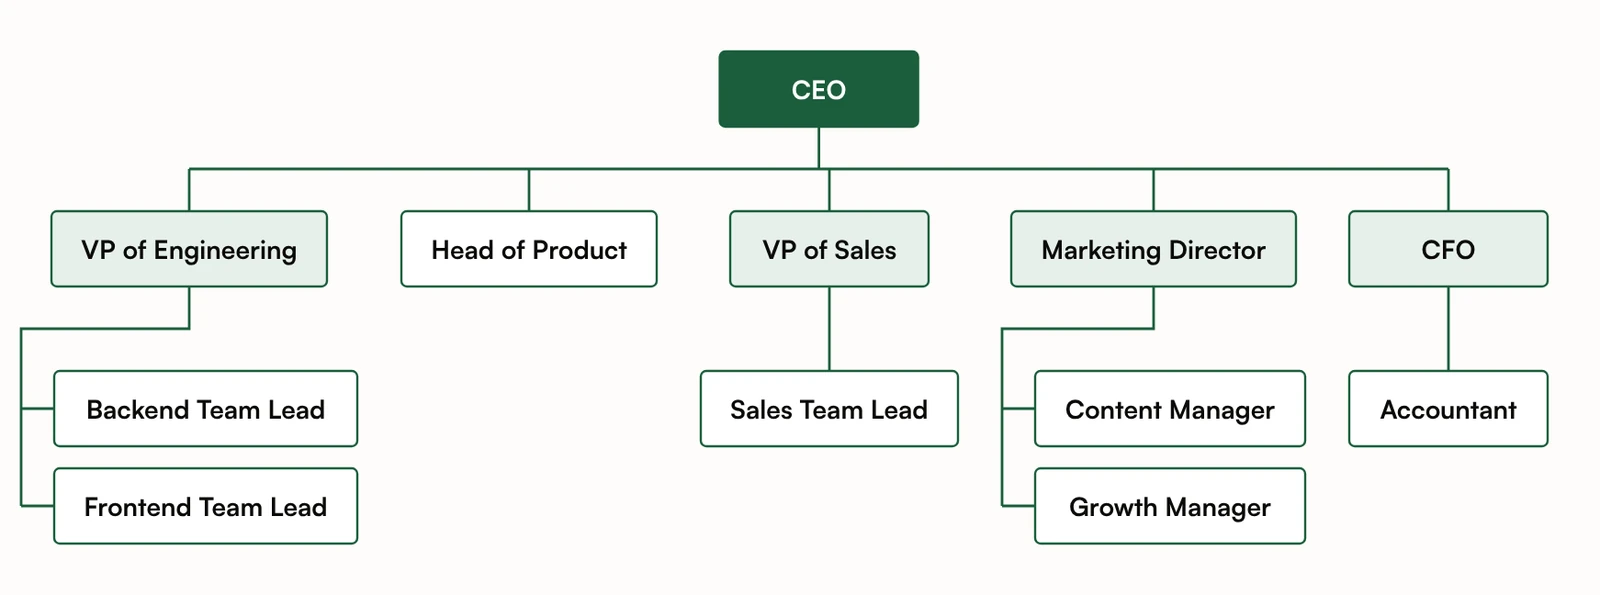
A functional org chart groups people by what they do: engineering, product, sales, marketing and finance each have their own head, who reports to the CEO. It is the most common structure for companies with one main product, because people with the same skills work and grow together.
The weak spot is the space between departments. When you look at a chart like this one, ask who coordinates the work that crosses them, such as a product launch.
Text used for this chart
Functional org chart for a software company. The CEO leads five departments: Engineering (VP of Engineering, with a backend team lead and a frontend team lead), Product (Head of Product), Sales (VP of Sales, with a sales team lead), Marketing (Marketing Director, with a content manager and a growth manager) and Finance (CFO, with an accountant).
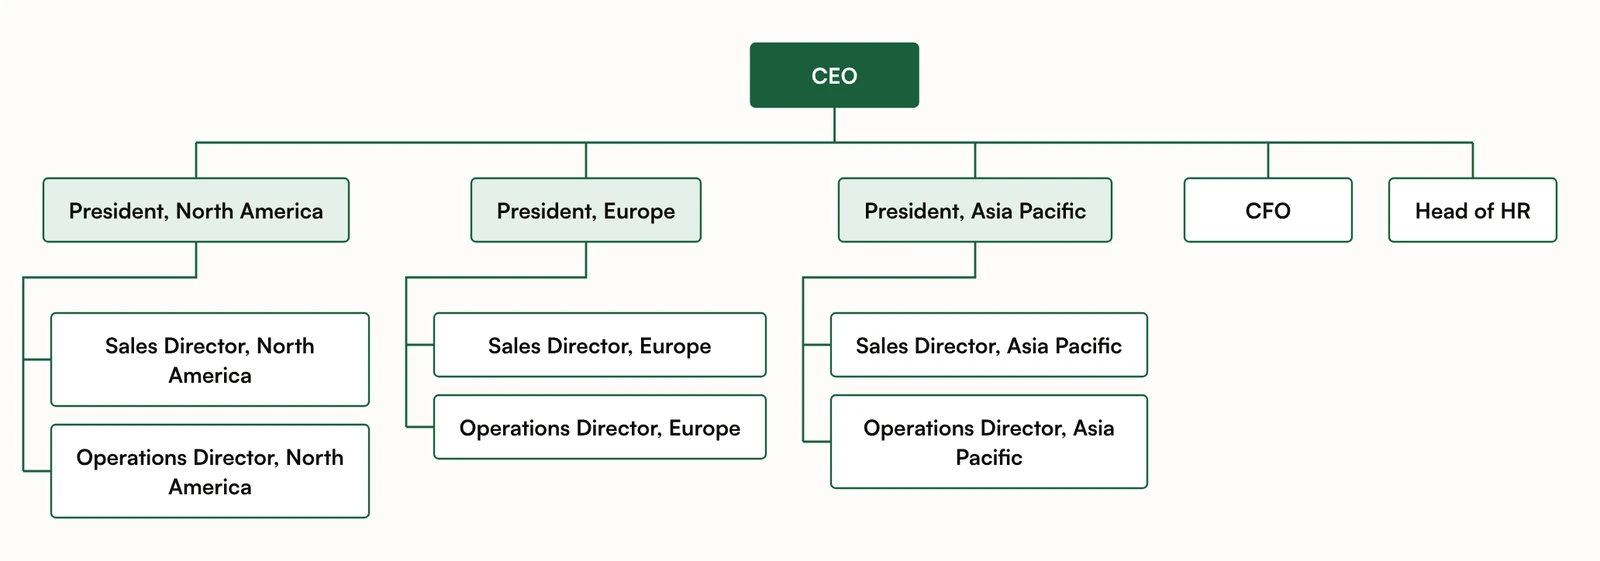
A divisional org chart splits the company into units that each run almost like their own business, by region, product line or customer group. Here each region has a president with their own sales and operations directors, while finance and HR stay central and report to the CEO.
To make a divisional chart by product line instead, replace the regions with your products; the structure stays the same.
Text used for this chart
Divisional org chart by region: the CEO oversees three regional presidents for North America, Europe and Asia Pacific. Each regional president has a sales director and an operations director. The CFO and the head of HR also report to the CEO.
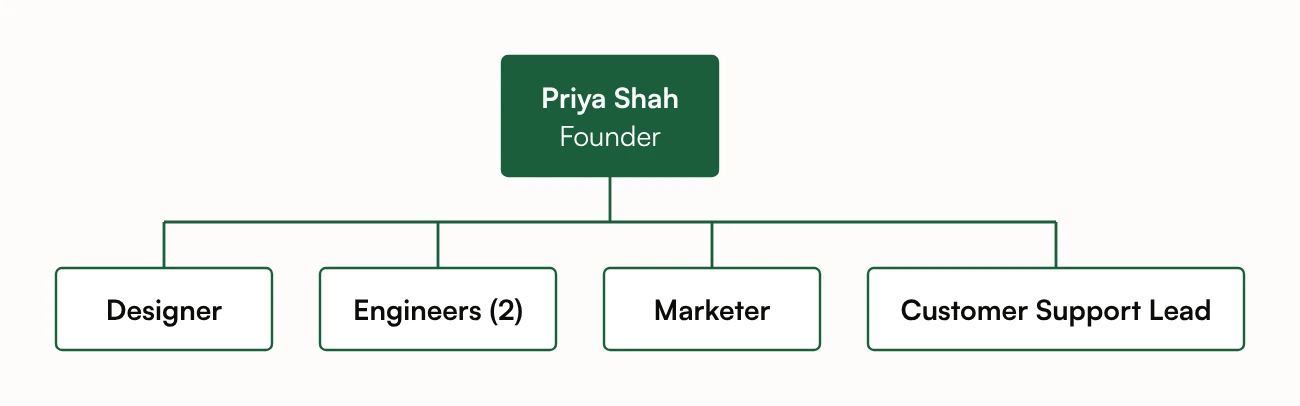
In a flat organization there are few or no middle managers: everyone reports to the founder or to one leader. It suits small teams that need to move fast, and the chart is a single row.
When that row grows past six or seven people, the chart is telling you that the leader has more direct reports than they can support, and it is usually time to add a team lead.
Text used for this chart
Flat team: the founder, Priya Shah, works directly with a designer, two engineers, a marketer and a customer support lead.
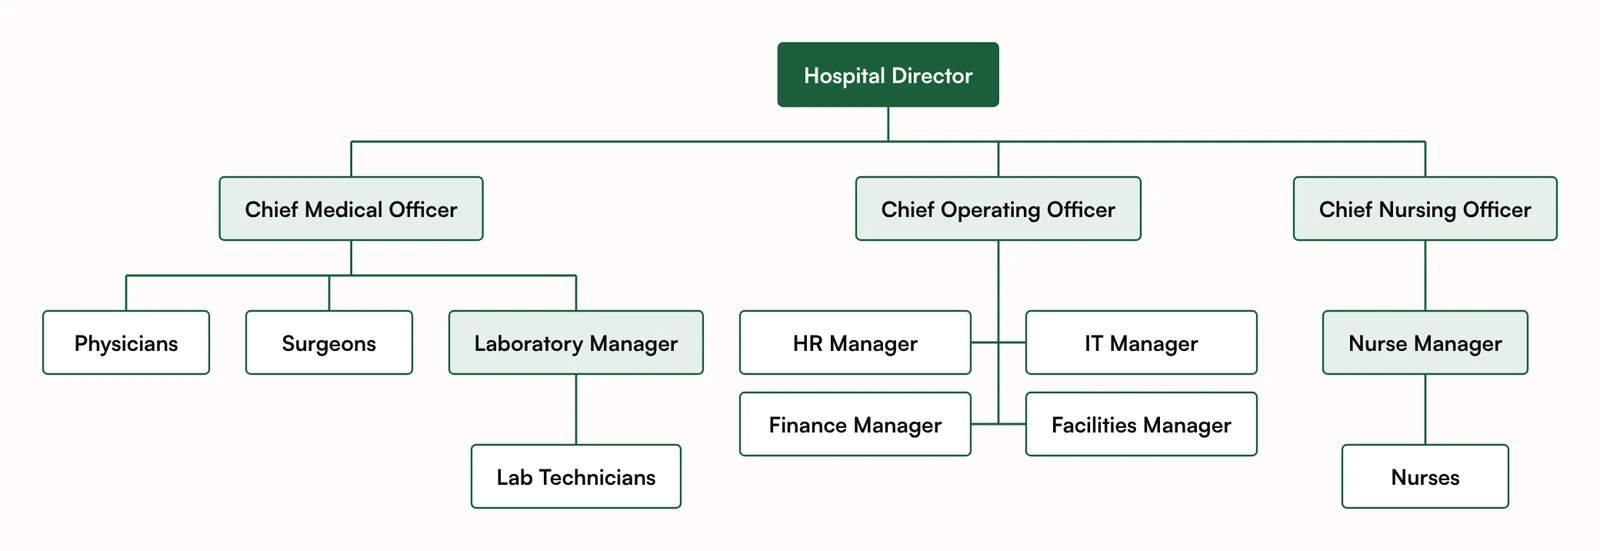
Hospitals usually split into three lines under the director: medical staff under a chief medical officer, nursing under a chief nursing officer, and support services such as HR, IT, finance and facilities under a chief operating officer.
This chart came from just the words "Org chart for a small hospital". Given only the kind of organization, the generator draws its usual structure as roles without names. It never invents people's names, so add yours to the text and generate again.
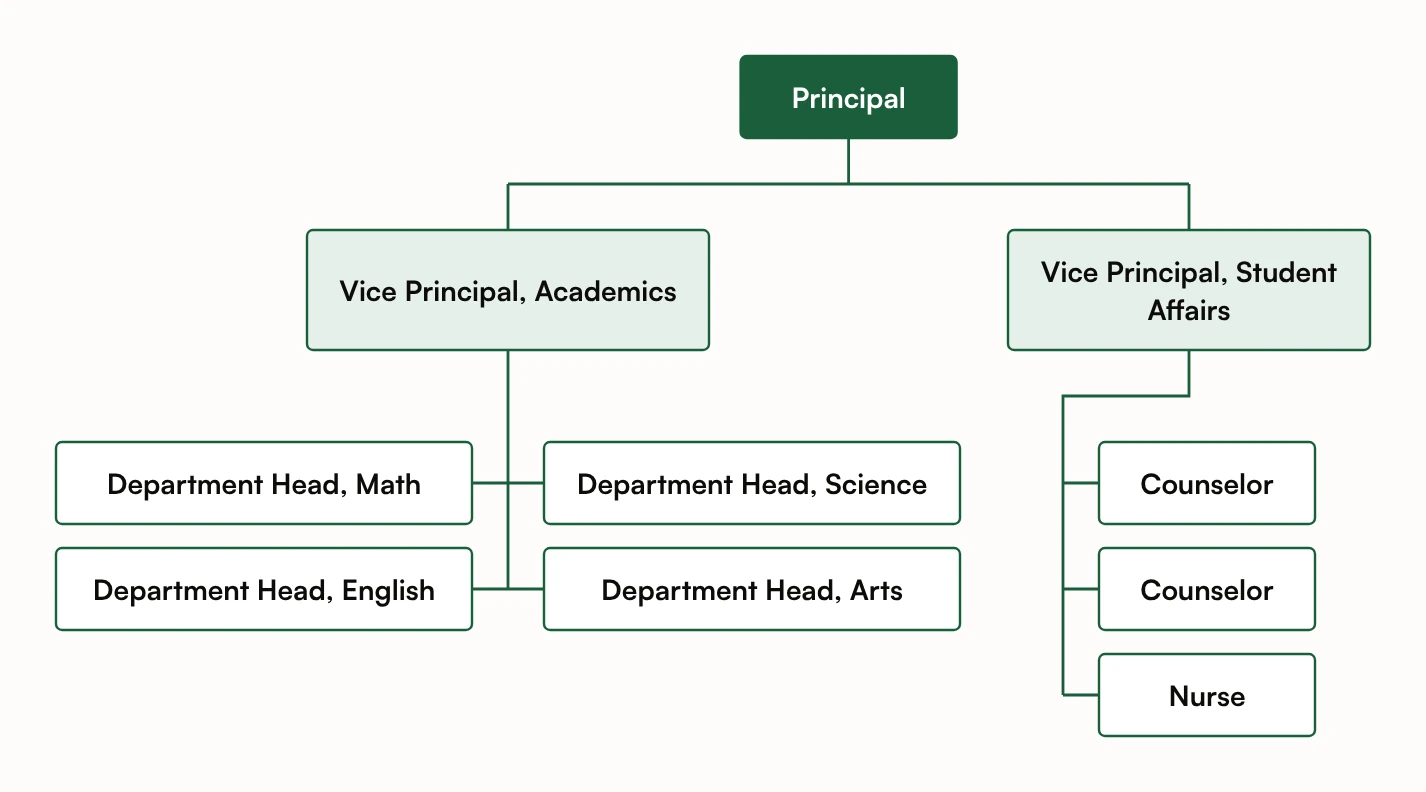
A school org chart puts the principal at the top, with vice principals who each own one area: teaching and learning on one side, students' welfare on the other. Department heads report to the vice principal for academics; the counselors and the school nurse report to the vice principal for student affairs.
For a larger school, add the teachers under each department head. A chart holds up to 40 people, so beyond that, make one chart for the leadership team and one for each department.
Text used for this chart
School org chart: principal, two vice principals (academics and student affairs), department heads for math, science, English and arts under academics, two counselors and a nurse under student affairs.
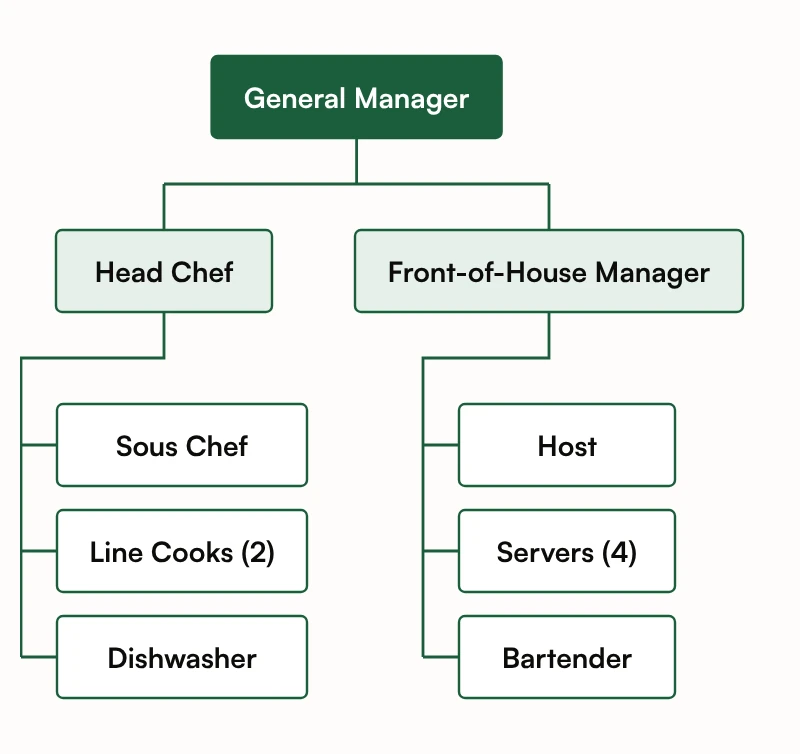
Restaurants divide into the kitchen (back of house) and the dining room (front of house). The head chef runs the kitchen staff, the front-of-house manager runs the host, servers and bar, and both report to the general manager or owner.
Roles held by several people, like "Servers (4)", are shown once with the number, which keeps the chart readable for a team whose members change often.
Text used for this chart
Restaurant org chart: the general manager oversees the head chef and the front-of-house manager. The head chef leads a sous chef, two line cooks and a dishwasher. The front-of-house manager leads a host, four servers and a bartender.
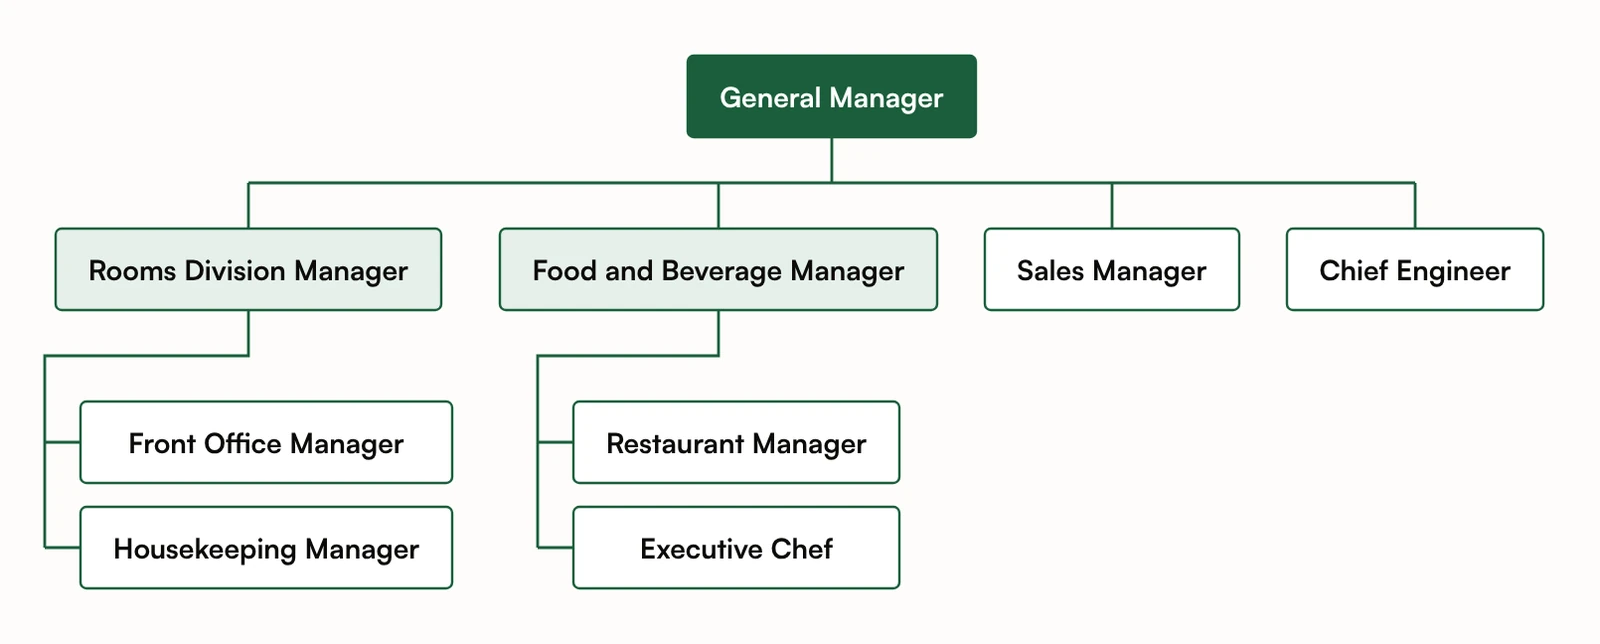
A hotel is organized by department under the general manager: the rooms division (front office and housekeeping), food and beverage (restaurants and kitchen), sales, and engineering or maintenance. Larger hotels add revenue management, security or a spa at the same level.
A department head with no team in the text, like the sales manager here, appears as a single box; add a sentence about their team when you need it.
Text used for this chart
Hotel org chart: the general manager oversees a rooms division manager, a food and beverage manager, a sales manager and a chief engineer. The rooms division manager leads the front office manager and the housekeeping manager. The food and beverage manager leads the restaurant manager and the executive chef.
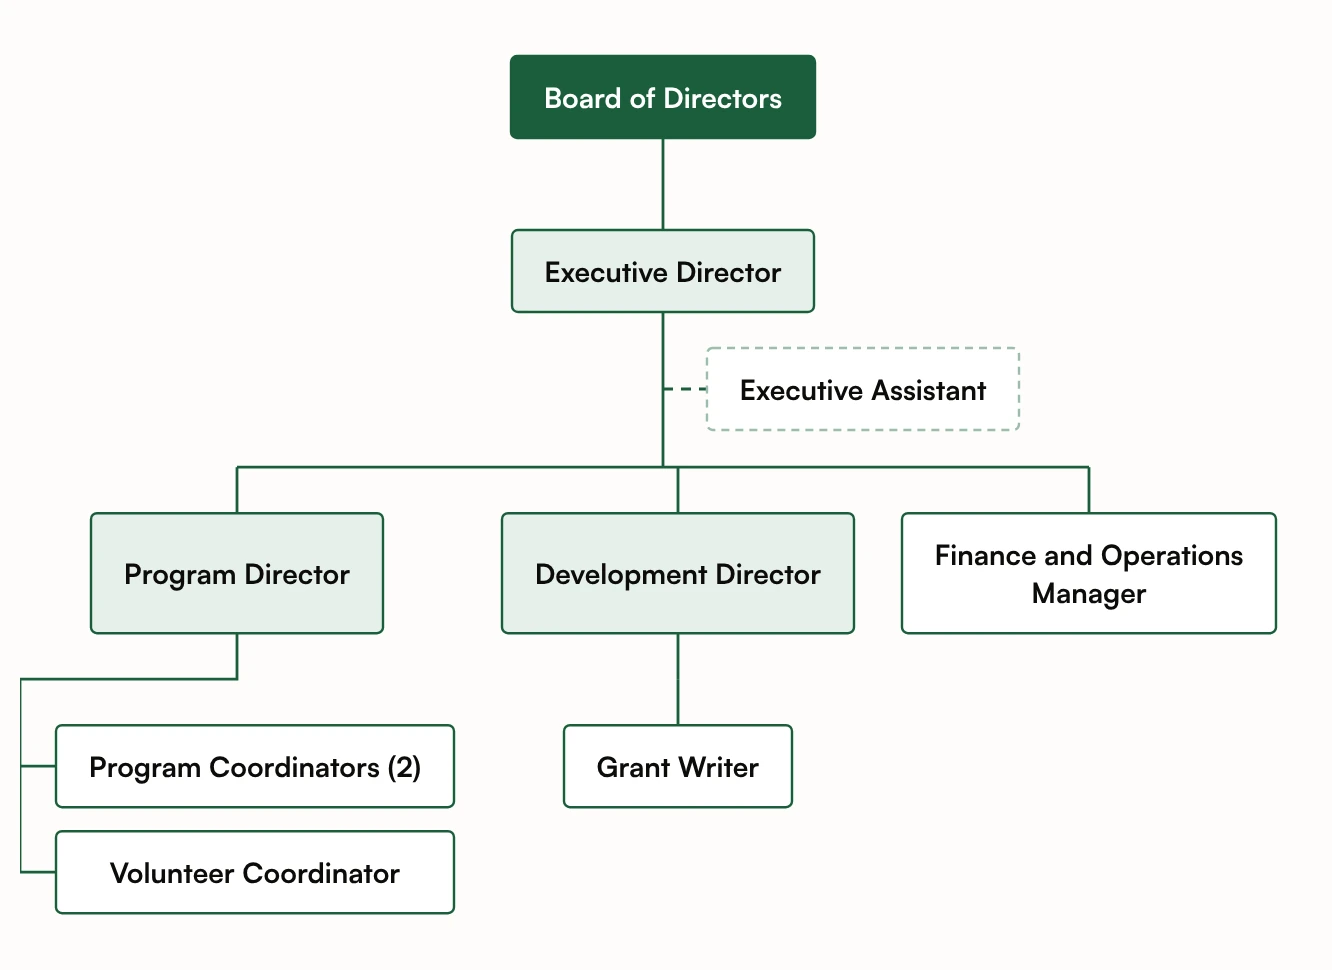
Nonprofits put the board of directors at the top: the board oversees the executive director, who runs the organization day to day. Under the executive director you usually find programs (the work the nonprofit exists for), development or fundraising, and finance and operations.
Volunteers rarely appear as individual boxes. A volunteer coordinator, as here, shows where they fit without listing everyone.
Text used for this chart
Nonprofit org chart: a board of directors oversees the executive director, who has an executive assistant. Reporting to the executive director: a program director with two program coordinators and a volunteer coordinator, a development director with a grant writer, and a finance and operations manager.
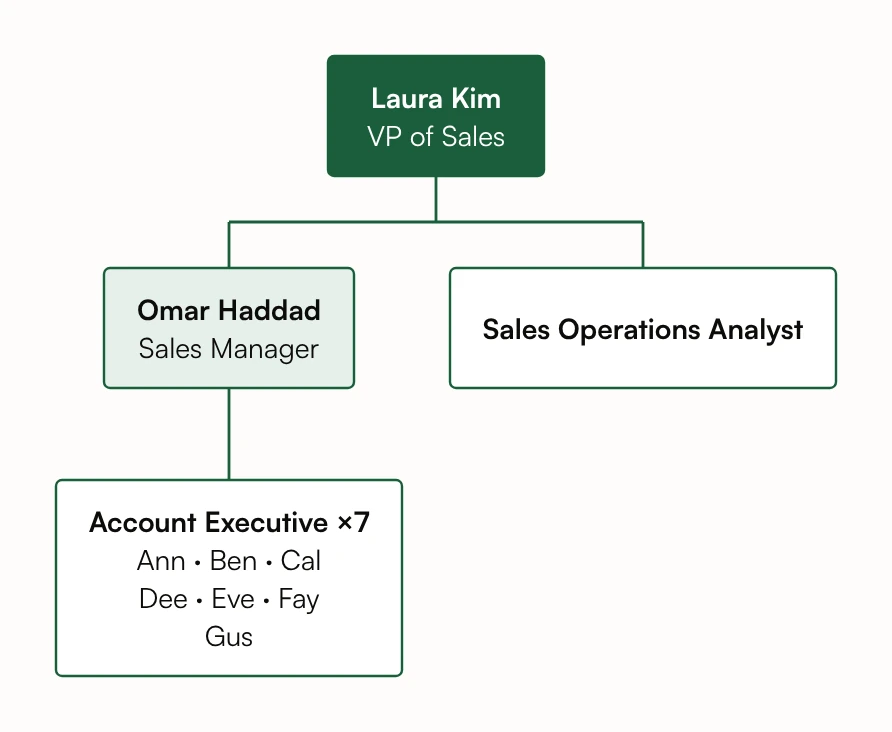
A team chart zooms in on one department. This sales team has a VP, a sales manager with seven account executives, and an analyst who supports the whole team.
When a manager has more than five people with the same role and no reports of their own, the generator puts them in one box with their names, three to a line, so a large team does not stretch the chart across the page.
Text used for this chart
Sales team: Laura Kim is VP of Sales. Sales manager Omar Haddad reports to her and leads seven account executives: Ann, Ben, Cal, Dee, Eve, Fay and Gus. A sales operations analyst also reports to Laura.
In a matrix organization, people report to two managers at once: a functional manager, such as the head of engineering, and a project or product manager. Drawn as boxes and lines, that means some boxes have two lines coming into them, and the chart gets crowded fast.
Eidora's org chart generator draws one reporting line per person, so it does not draw a true matrix chart. The usual workaround works well: put each person under their main manager and the project in their title, such as "Engineer, Project Atlas", or make one chart per project.
How to Make Your Own Org Chart From an Example
Step 1: Pick the closest example. Start from the structure that looks most like yours, even if the size is different.
Step 2: Press Use this text. The org chart generator opens with the example's text in its box.
Step 3: Change the names and roles. Write who reports to whom in plain sentences ("Ann and Ben report to Sam"), or paste a list. A role without a name is drawn as the role, and a number such as "3 designers" is kept as a count.
Step 4: Press Generate. The chart is ready in under 30 seconds. You can make one diagram a day without an account; a free account gets 16 credits to start and 4 free credits a day, and each chart uses 4.
Step 5: Download or edit it. Download the chart as a PNG or SVG, copy its Mermaid code, or press Edit in draw.io to move and restyle every box. Downloading needs a free account.
Tips for a Clear Org Chart
One box per person, one line per report. If someone really has two managers, pick the main one and mention the other in their title.
Keep titles short. "VP Sales" reads better than "Vice President of Sales and Business Development, Americas". Use the shortest title people recognize.
Group large teams. Ten people with the same role under one manager are easier to read as one box with a count than as ten boxes.
Split big organizations. One chart for the leadership team and one per department beats a single chart of 200 boxes that nobody can read.
Show open positions. A box with only a role, such as "Head of Marketing", is a clear way to show a vacancy or a planned hire.
Date it. Org charts go out of date quickly. Put the date in the file name and keep the text you made it from, so an update takes a minute.
Quick Answers About Org Chart Examples
What is an example of an organizational chart? A small business chart is the simplest example: the owner at the top, the managers who report to the owner on the next row, and each manager's team below them. The 12 examples above cover the most common types and industries.
What are the main types of org charts? Hierarchical (a top-down chain of command), functional (grouped by department), divisional (grouped by region, product or customer), flat (few or no middle managers) and matrix (two managers per person).
What should an org chart include? Each person's name and job title, or the title alone for an open position, and a line from each manager to the people who report to them. Photos, phone numbers and locations are optional.
How do I make an org chart for free? Describe your team or paste a list of names and titles into Eidora's org chart generator. You can make one diagram a day without an account and see the result.
Can I edit an org chart after it is made? Yes. Change the text and generate again, or press Edit in draw.io to move and restyle the boxes there.
Can I use these examples for my own organization? Yes. Press Use this text under any example, replace the names and roles with your own, and generate your chart.
Start From the Closest Example
Most org charts are variations on a handful of shapes. Find the example above that looks most like your organization, press Use this text and change the names: you will have a clean, editable chart in less time than it takes to line up boxes by hand. Or start from a blank box in the org chart generator.
Describe it in a few sentences or paste a list, and get a clean, editable chart in under 30 seconds. Free to try: one diagram a day without an account.